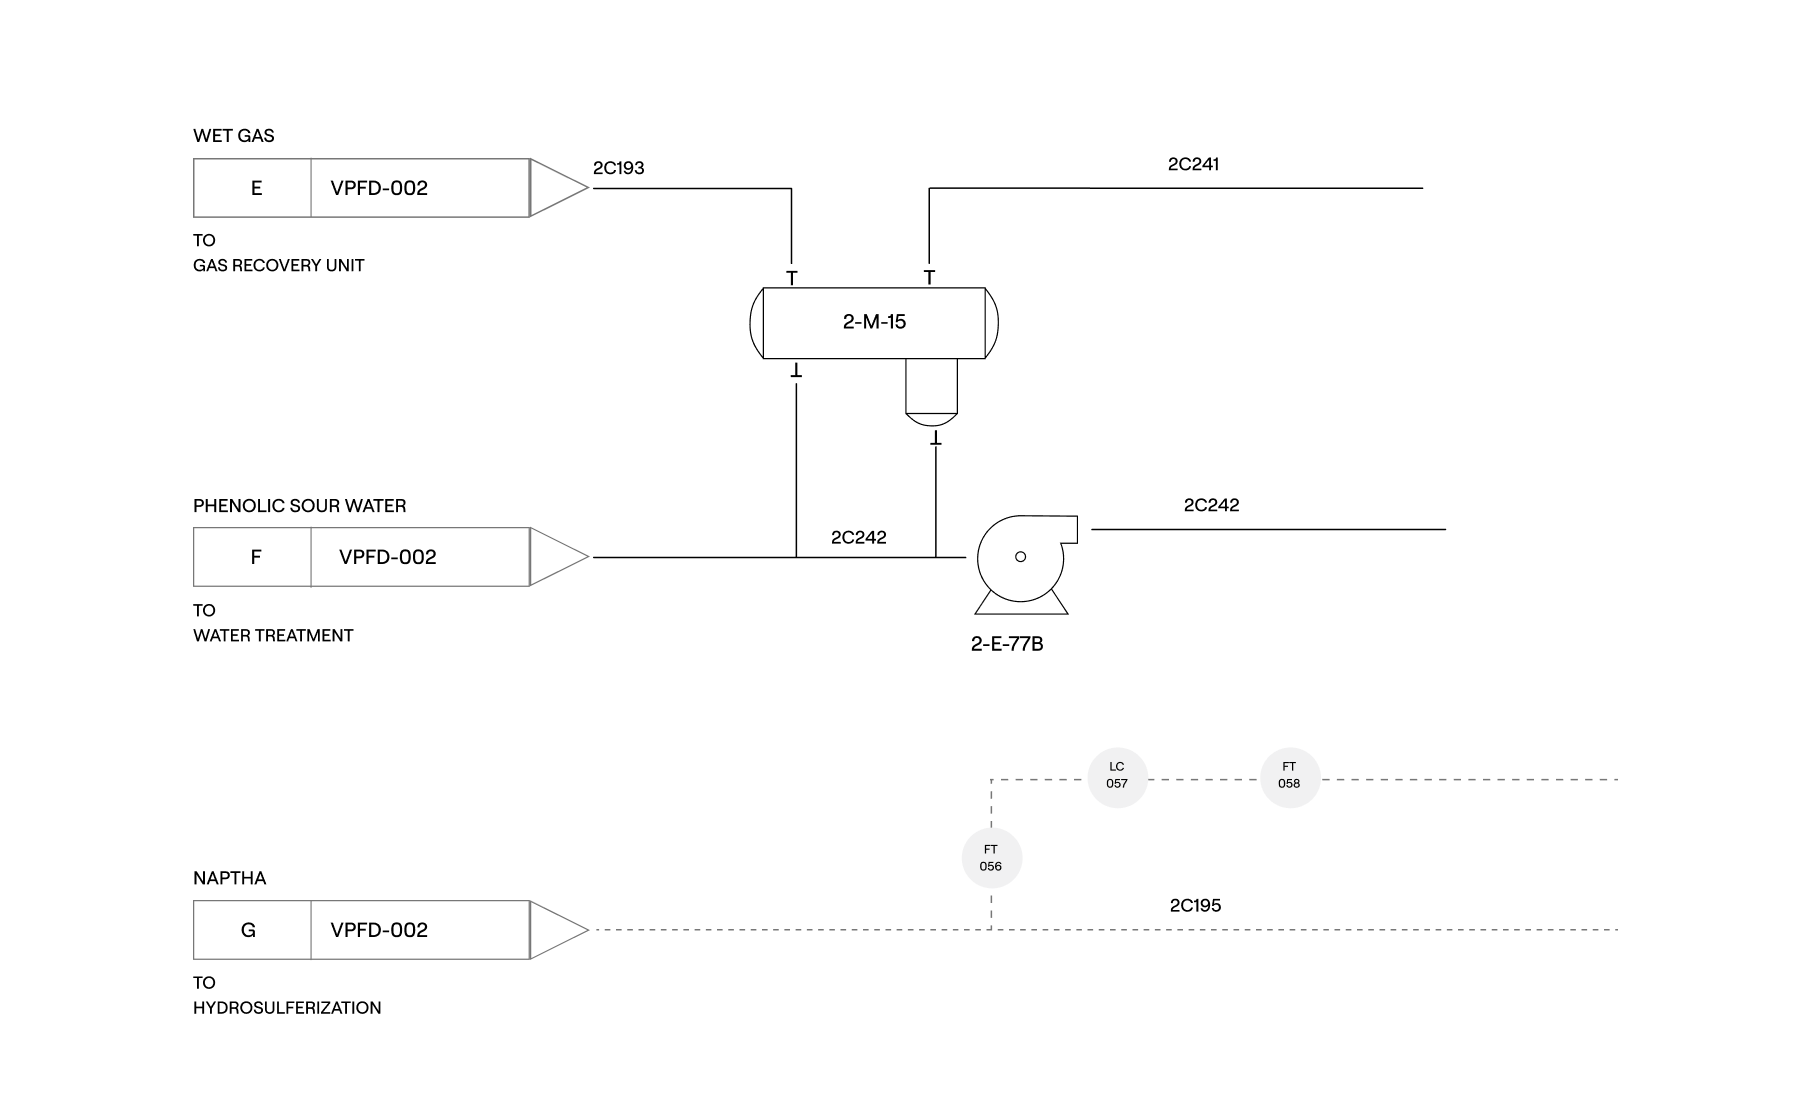
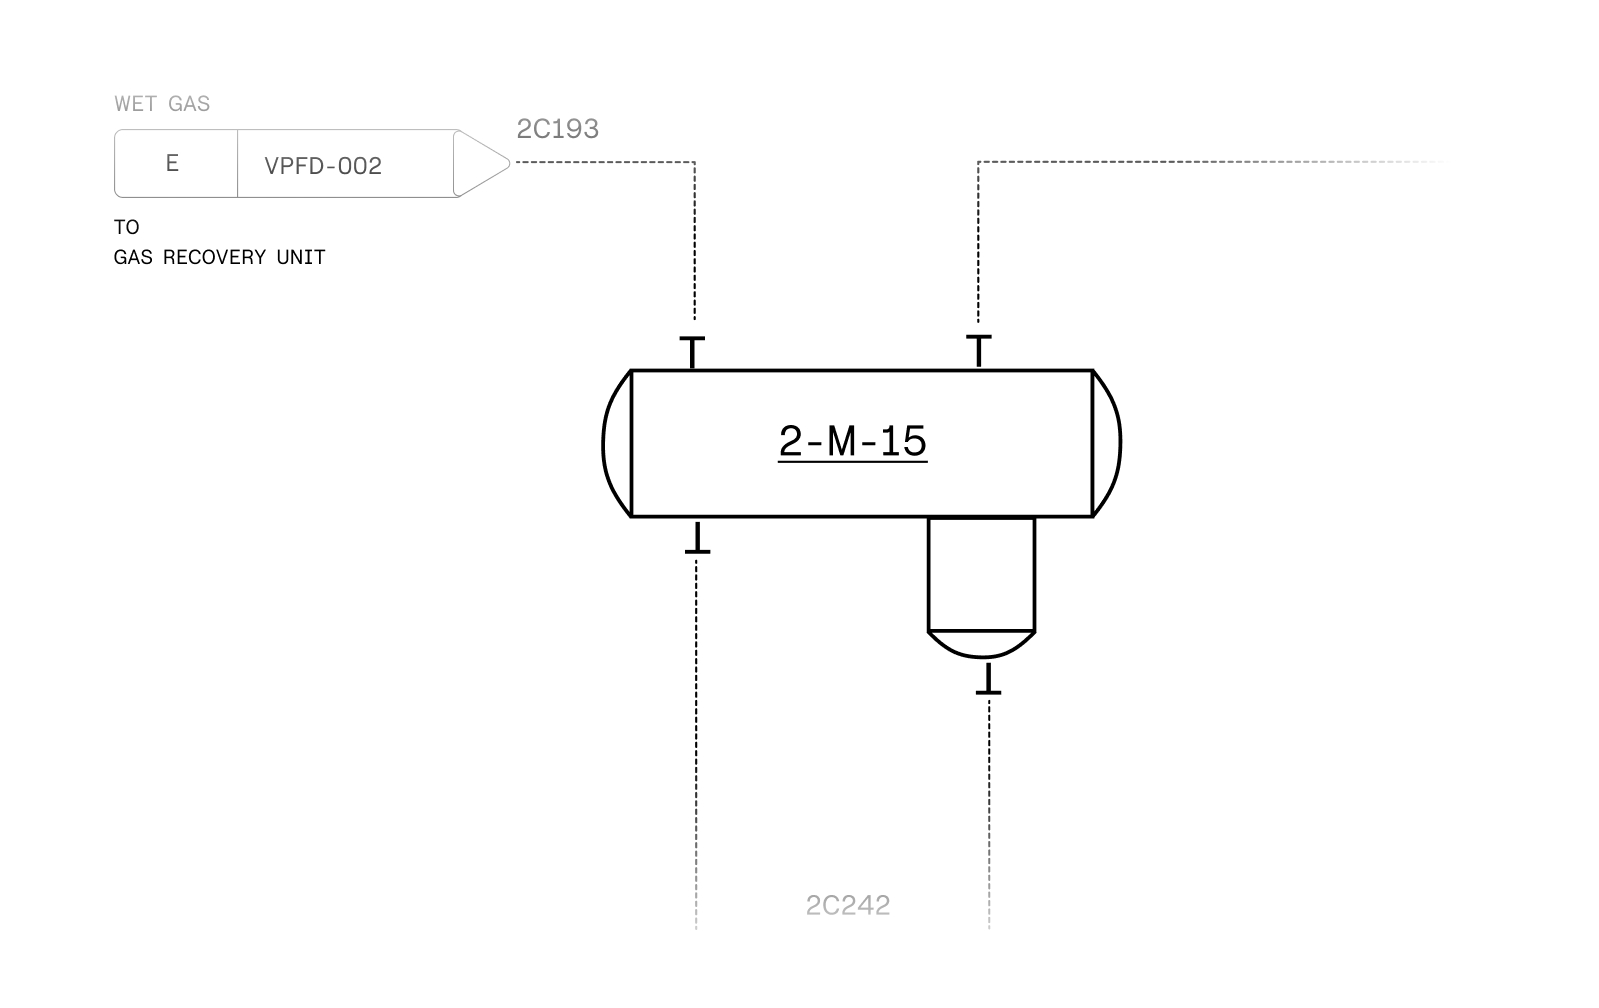
The revolutionary tool for that converts legacy P&ID's to intelligent, interactive drawings - in seconds.
Quickly move between converted drawings simply by tapping assets that span multiple drawings.
Stakeholders can redline directly on the intelligent drawing enabling real-time collaboration across the enterprise.
Realize your return on investment sooner with incredibly fast conversion speed and pin-point accuracy.
Align asset variables with instrument labels to set-up your predictive analytics software.
Create your plant’s asset hierarchy to implement or restructure your CMMS/ERP systems.
Use the data from your drawings to verify asset coverage in your plant’s existing systems.
A major 300KBPD in Texas aimed to implement a comprehensive predictive analytics program to optimize its processes, minimize downtime, and improve overall performance. This involved analyzing 5,000 P&IDs, aligning equipment variables with instrument labels, mapping these instruments to data channels, and integrating with the plant's data historian.
The IDP's advanced capabilities enabled the rapid alignment of equipment variables with instrument labels on the P&IDs. Being a collaborative platform, 20 engineers were able to work concurrently on the same set of drawings to ensure deployment in a timely manner. Following the analysis on the P&IDs, the instrument labels were mapped to their corresponding data historian tags to enable the implementation of the predictive analytics system.
By utilizing VisualAIM's IDP, the refinery was able to execute the project in 3 months instead of the originally expected 2.5 years of implementation by manual methods. This reduction in time saved valuable resources and allowed for rapid deployment.
Interactive drawings on the IDP enable enterprise-wide collaboration and data visualization for asset management, maintenance, and operations in realtime.
Connect your data sources quickly and securely to the Intelligent Drawing Platform via API’s. Synchronize with your Document Management, Asset Performance, Computerized Maintenance, and Data Historian Systems.
Assets are available across the enterprise for all stakeholders - from field technicians to asset managers. Collaborate in real-time from desktop and mobile devices.
Drill down into asset details directly on the drawing to see related information, associated files, and more.
Increases efficiencies by 30% using the asset search capability. Once you find your target diagram, easily navigate across drawings through off-page connector links.
Redline drawings directly from your desktop or mobile device. Pick the symbols from your P&ID library to use as stencils when creating redlines. This makes the redlining process easier while allowing users to track and report on drawing changes.
Define process lines from their source to destination with full understanding of line components and flow direction. Visualize process lines across multiple drawings in a single view to facilitate lockout tag-out or piping circuit visualization.
Use your highlighted PDFs as a reference to create piping circuit definitions on the Intelligent Drawings. Then export these back as layers on your master AutoCAD file.
Significantly reduce risk with data visualization. Layers on the drawings allow for real-time display of information such as HAZARD nodes, circuit definitions, risk levels, operating conditions, and other information directly on the drawing.